Satellite Spectral Imagery – Normalised Difference Vegetation Index (NDVI)
Sentek Technologies now offers an investigative tool exclusive to IrriMAX Live. Used by irrigators, IrriMAX Live presents a Google Map View of the selected property where water gauges and soil status is available.
NDVI images are satellite images taken throughout cropping season. This is an optional service, like the Weather forecasting service MeteoBlue. NDVI measures the state of plant health based on how the plant reflects light at certain frequencies. Other images available include NDRE, MSAVI, ReCl and NDMI. Our offerings provide you with insights at 10m x 10m granularity on a frequent basis.
As customers, you can see 1-2 high resolution images per week of your crops tracking over- or under performance. This will help you tackle irrigation management, fertigation practices, crop diseases and irrigation system performance issues.
Furthermore, building up this data over time is an investment that you can realise by improving overall yield quantity or quality, reducing input costs, or expanding into new varietals or paddocks. Up to 18 months of historical data can also be accessed.
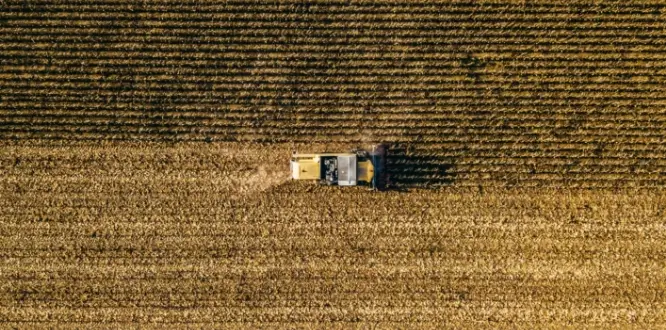
Figure 1: NDVI image of vines

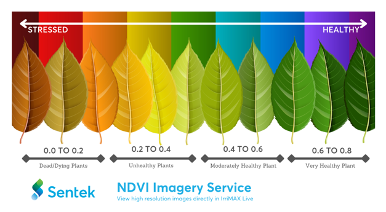
Plant health and vigour in the NDVI image is indicated by this colour scale.
Figure 2: Key to NDVI colour scale


Raw Normalised Difference Vegetation Index (NDVI). This gives you a simple score on how healthy your plants are.
Figure 3: NDVI images of a vineyard in November and December 2019 with associated soil moisture graphs showing crop water stress

Figure 4: NDVI images taken one year later after implementing a better irrigation management strategy avoiding soil moisture stress

Change in NDVI over time. This helps you understand how the crop is changing and whether different management strategies are working as well, or even better, than hoped.
Figure 5: NDVI change since the last image. Blue colours signify an improvement and reddish colours indicate a reduction in crop performance. White is unchanged.

Identification of high and low performing areas. This helps you determine which areas you may want to focus on to do tailored irrigation, fertigation, mulching, pruning etc.
Figure 6: 25% of the low and high performing Area on that date


Change in high and low performing areas. This tells you if tailored management strategies are working or not.
Figure 7: Existing high performing (green) and new high performing area (blue) since last image.
Existing low performing (yellow) and new low performing area (red) since last image.

For More Information Click Here